How to plot a matrix with ggplot? As gglot requires data as dataframes in long
format, we have to reshape the matrix. In the example below, we calculate the mandelbrot set as a two dimensional matrix, reshape it via the melt function from the reshape package and plot it with gglot.
Preparation - load packages
library(parallel)
library(ggplot2)
library(reshape2)
The mandelbrot set
The mandelbrot set is created by applying a specific function \(z^2+z\) iteratively on
each point \(z=x+yi\) of the complex plane and record the number of iterations until the
value exceeds a limit.
limit <- 2
maxiter <-250

mandel_func <- function(z)
{
  i<-0
  nz <- z
  while(i<maxiter && abs(nz)<limit)
  {
    nz <- nz^2+z
    i <- i + 1
  }
  i
}

cx <- 300
cy <- cx
xvals <- 2.5*((1:cx)/cx - .75)
yvals <- 2.5i*((1:cy)/cy - .5)
cplane <- outer(xvals, yvals, "+")
dimnames(cplane)<-list(xvals,Im(yvals))

cl <- makeCluster(detectCores())
clusterExport(cl,list("limit", "maxiter"))
mandel_set <- parApply(cl, cplane, c(1,2), mandel_func)
stopCluster(cl)

str(mandel_set)
##  num [1:300, 1:300] 0 0 0 0 0 0 0 0 0 0 ...
##  - attr(*, "dimnames")=List of 2
##   ..$ : chr [1:300] "-1.86666666666667" "-1.85833333333333" "-1.85" "-1.84166666666667" ...
##   ..$ : chr [1:300] "-1.24166666666667" "-1.23333333333333" "-1.225" "-1.21666666666667" ...
Convert the matrix to a data.frame in long format
We use the melt function from the reshape2 package to create a dataframe with 3 columns: real, im holding the real and imaginary coordinate of the complex numbers, iterations holding the number of iterations.
mandel_df <- melt(mandel_set, varnames = c("real","im"),value.name="iterations")
head(mandel_df)
##        real        im iterations
## 1 -1.866667 -1.241667          0
## 2 -1.858333 -1.241667          0
## 3 -1.850000 -1.241667          0
## 4 -1.841667 -1.241667          0
## 5 -1.833333 -1.241667          0
## 6 -1.825000 -1.241667          0
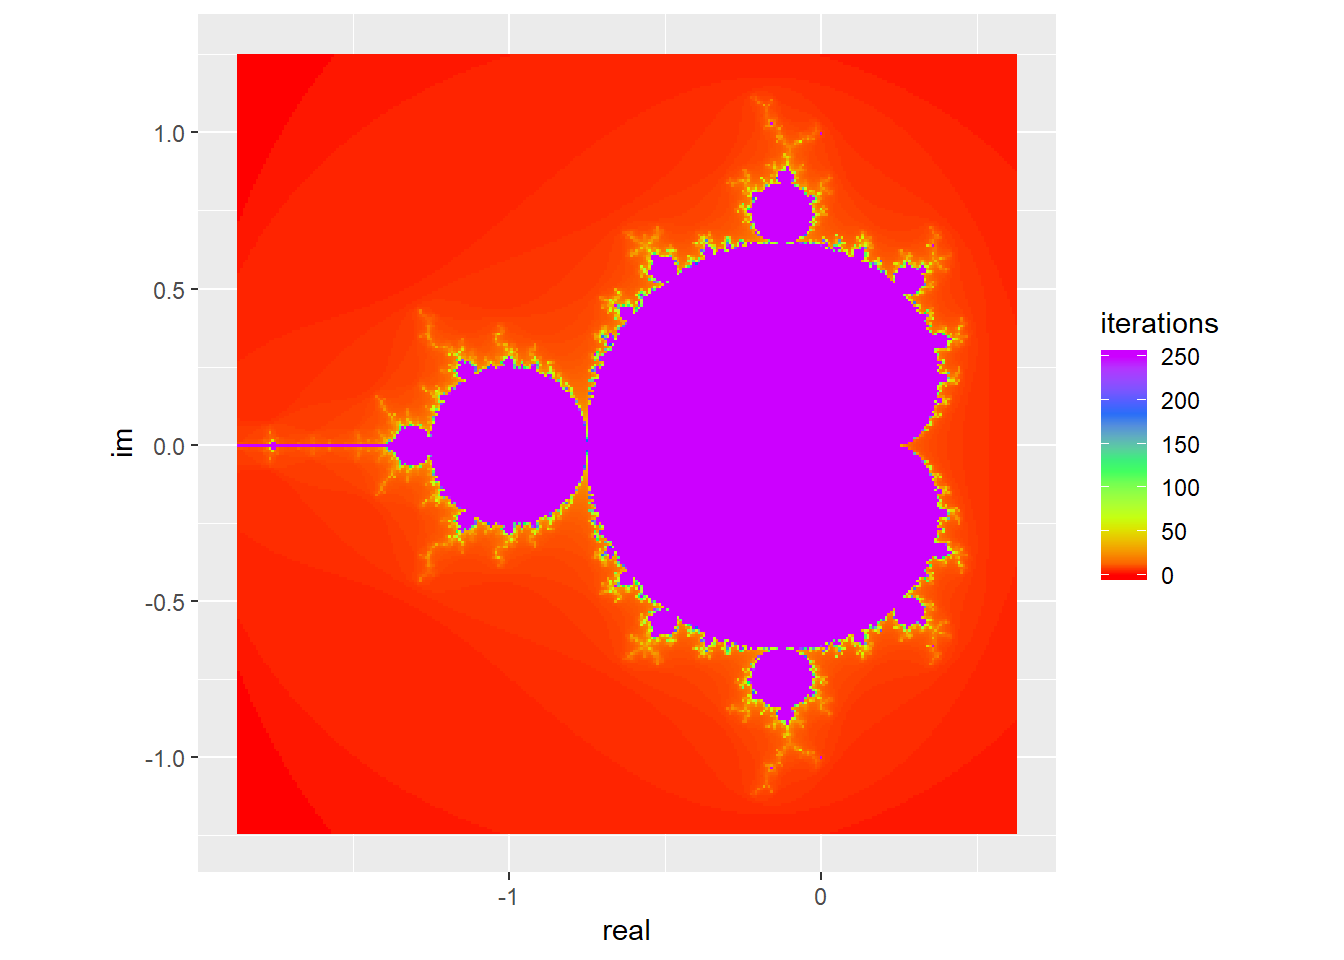
Plot the data.frame as raster image
ggplot(mandel_df, aes(x=real, y=im, fill=iterations))  +
  geom_raster() +
  scale_fill_gradientn(colours=rainbow(5)) +
  coord_equal()
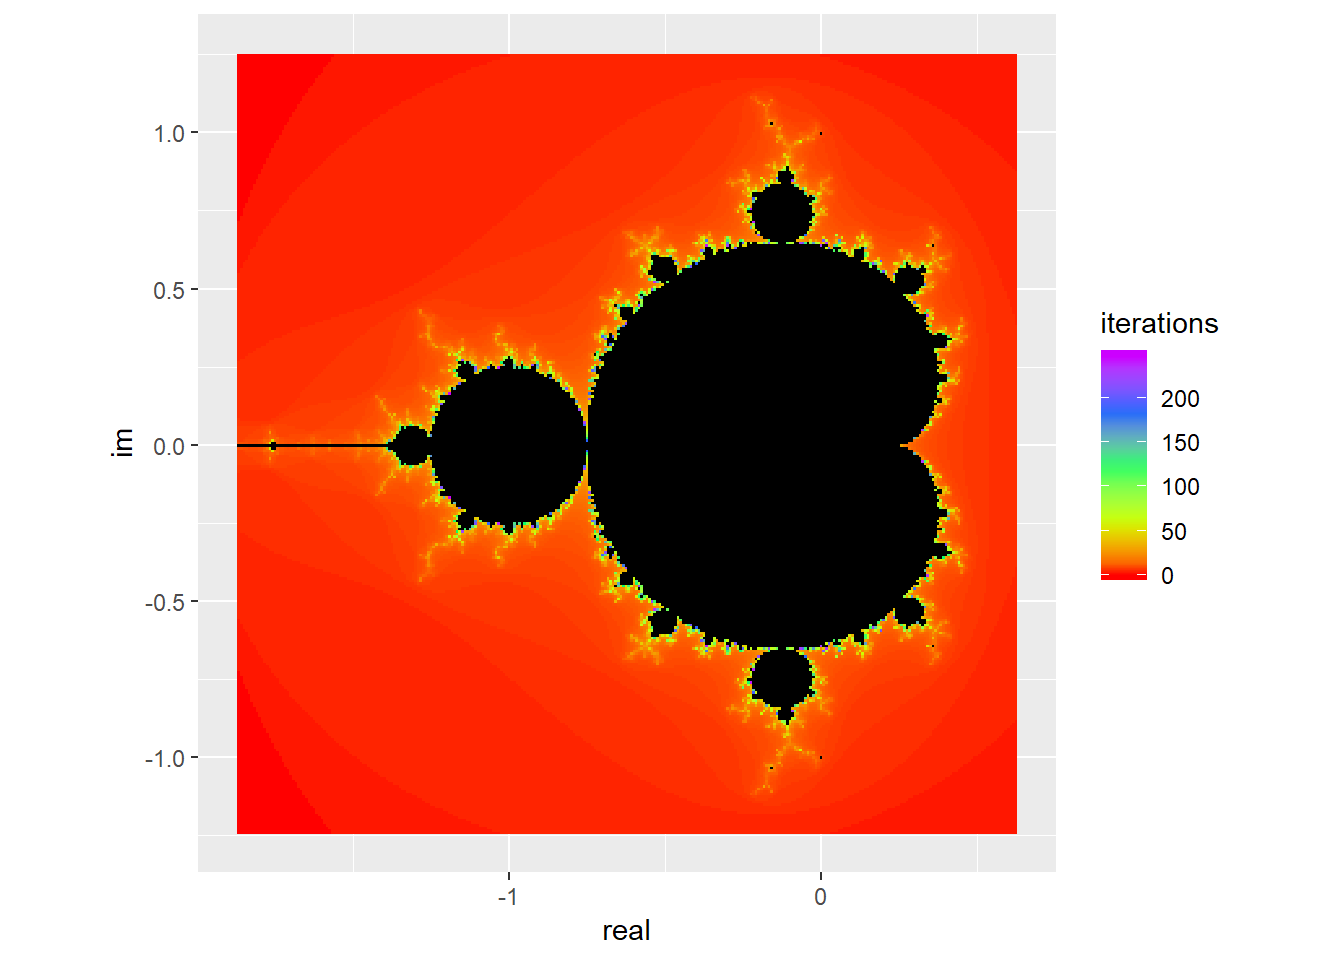
Color maxiterations black
To color the points with maximal iterations black, we set the iterations of these points to NA and tell ggplot to color NA-values black.
mandel_df$iterations[mandel_df$iterations==maxiter] <- NA
ggplot(mandel_df, aes(x=real, y=im, fill=iterations))  +
  geom_raster() +
  scale_fill_gradientn(colours=rainbow(5),na.value="black") +
  coord_equal()